

Some time ago I needed to switch off asserts for one of the configurations in our project. I kinda read somewhere that whether or not asserts compile to the resulting binary depends primarily on the code optimisation level. But I wondered if there was any way to control the asserts without changing the optimisation level? What if I don’t want to touch it for the asserts only? Do we have separate optimisation levels for Swift and Objective-C code? What do they mean, what are they influence on? How do two compilers in the mixed Swift/ObjC project work together optimising the code? What specifically the compiler does for each optimisation level?
To answer these question I tried to get some details about xcode build pipeline, about how the compilers work and where is the place for the code optimization in the process. Tell you in advance that I couldn’t find satisfying answers for all of my questions, but the picture of the building process, compilers and optimisation levels became more clear for me.
Compilers in building iOS apps
The compiler is just a big function which takes a string and returns a big int
-Scott Owens ICFP 2017
First some general theory. There are several ways to build an iOS/macOS project: using Xcode, xcodebuild from the command line, fastlane (which uses xcodebuild under the hood), manual scripts or something else. Anyway you need to do the same set of actions to make the app package which can be installed on a device.
$ swiftc -module-name YourModule -target arm64-apple-ios12.0 -swift-version 4.2 ...
$ clang -x objective-c -arch arm64 ... YourFile.m -o YourFile.o
$ ld -o YourProject -framework YourFile.o ...
$ actool --app-icon AppIcon ... Assets.xcassets
$ ...
or
$ xcodebuild -target YourProject -xcconfig your_configuration_file.xcconfig
Code compilation is one of the steps you need to do (together with linking, bundling the resources, code signing and so on).
Originally we have our source code written in some high level programming language: ObjC, Swift, C++ (you also have some resources like images, strings, fonts etc., but they are out of scope of this topic). Compiler’s job is to translate our high level source code into low level machine code to create an executable program. There are different types of compilers but in our iOS/macOS world we deal with ones which can be divided into a frontend and a backend. The frontend takes our source code and converts it into some intermediate language understandable for the backend. The backend takes this intermediate representation and turns it into machine code with the regard of the specific operation system and processor architecture. That’s the essence of this two entities.
There are different pipelines for Swift and ObjC but both of them are backed by LLVM.
LLVM is a big project including LLVM Core as a backend, Clang as “LLVM native” frontend for C language family (C/ObjC/C++/ObjC++) and interaction protocol between the frontend and the backend. The major part of this protocol is LLVM IR (Intermediate Representation) - the intermediate language understandable for both the front and the back. It doesn’t matter for LLVM Core exactly what frontend has produced the IR-code out of the source code. The Core just takes this representation works with it and generates an executable or dynamic library.
Although Clang is sometimes considered as a part of LLVM, the entire idea of the LLVM project is that the frontend is decoupled from the backend. Swift development team (which includes several members of LLVM community) managed to leverage it and use the same LLVM Core as a backend for the swift compiler.
Objective-C pipeline
So for good old ObjC code the pipeline looks like this:
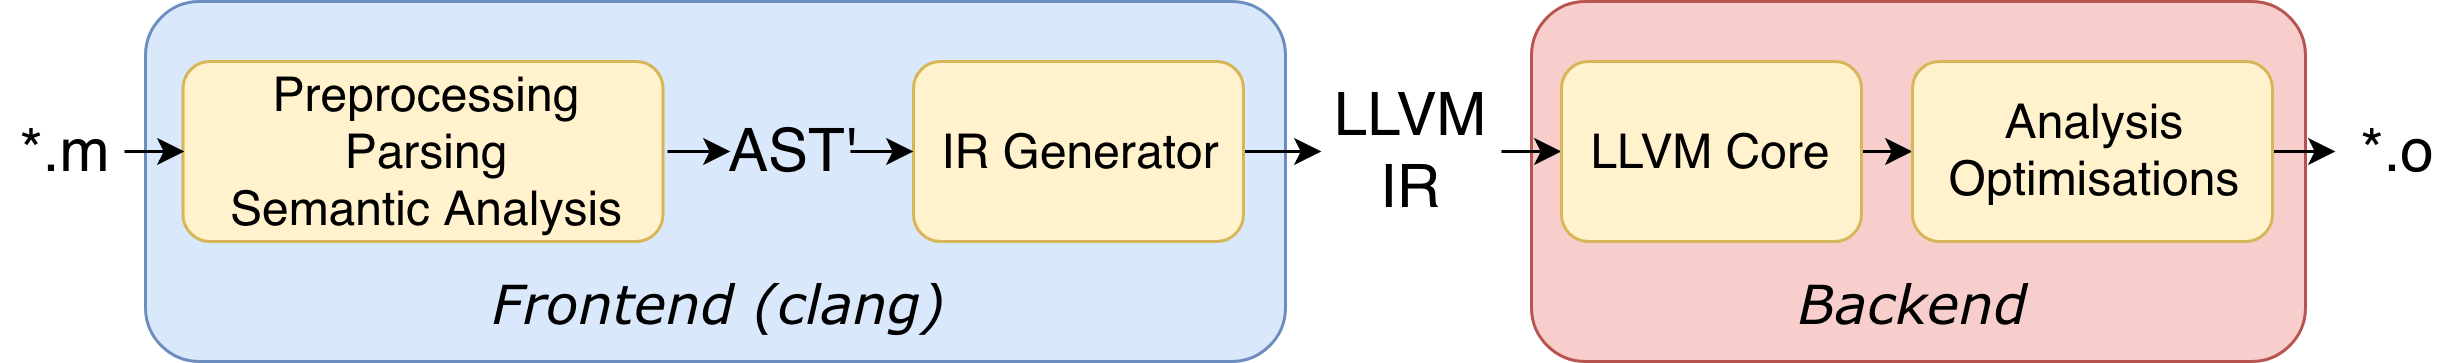
You can see that the first conversion Clang makes over your code is creation of AST’ (Abstract Syntax Tree) - the representation where all the functions, operators, variables, declarations.. are nodes of the huge semantic tree. Here is an example of AST:
$ cat test.cc
 int f(int x) {
  int result = (x / 42);
  return result;
 }
turns into
$ clang -Xclang -ast-dump -fsyntax-only test.cc
 TranslationUnitDecl 0x5aea0d0 <<invalid sloc>>
 ... cutting out internal declarations of clang ...
 `-FunctionDecl 0x5aeab50 <test.cc:1:1, line:4:1> f 'int (int)'
  |-ParmVarDecl 0x5aeaa90 <line:1:7, col:11> x 'int'
  `-CompoundStmt 0x5aead88 <col:14, line:4:1>
   |-DeclStmt 0x5aead10 <line:2:3, col:24>
   | `-VarDecl 0x5aeac10 <col:3, col:23> result 'int'
   |  `-ParenExpr 0x5aeacf0 <col:16, col:23> 'int'
   |   `-BinaryOperator 0x5aeacc8 <col:17, col:21> 'int' '/'
   |    |-ImplicitCastExpr 0x5aeacb0 <col:17> 'int' <LValueToRValue>
   |    | `-DeclRefExpr 0x5aeac68 <col:17> 'int' lvalue ParmVar 0x5aeaa90 'x' 'int'
   |    `-IntegerLiteral 0x5aeac90 <col:21> 'int' 42
   `-ReturnStmt 0x5aead68 <line:3:3, col:10>
    `-ImplicitCastExpr 0x5aead50 <col:10> 'int' <LValueToRValue>
     `-DeclRefExpr 0x5aead28 <col:10> 'int' lvalue Var 0x5aeac10 'result' 'int'
Then AST is being converted into LLVM IR which is more low level (less human readable) but some part’s of the source code still can be understood (here is a detailed description of the language):
int main()
{
 return 0;
}
turns into
define i32 @main() #0 {
  %1 = alloca i32, align 4
  store i32 0, i32* %1
  ret i32 0
 }
LLVM IR is being passed from Clang to LLVM Core where the code is optimized (if applicable) and converted to a target specific machine code. As a result we have a bunch of object files (*.o) which are linked together later on and merged into an executable or dynamic library. The output of this last stage is typically called an “a.out”, “.dylib” or “.so” file.
As you could already see LLVM Core is the place where the code is optimized, and Intermediate Representation is specifically the source of these optimizations.
Here are LLVM optimization levels with brief corresponding descriptions:
- None [-O0] The compiler does not attempt to optimize code. With this setting, the compiler’s goal is to reduce the cost of compilation and to make debugging produce the expected results. Statements are independent: if you stop the program with a breakpoint between statements, you can then assign a new value to any variable or change the program counter to any other statement in the function and get exactly the results you would expect from the source code. Use this option during development when you are focused on solving logic errors and need a fast compile time. Do not use this option for shipping your executable.
- Fast [-O, O1] The compiler performs simple optimizations to boost code performance while minimizing the impact to compile time. This option also uses more memory during compilation.
- Faster [-O2] The compiler performs nearly all supported optimizations that do not require a space-time tradeoff. The compiler does not perform loop unrolling or function inlining with this option. This option increases both compilation time and the performance of generated code.
- Fastest [-O3] The compiler performs all optimizations in an attempt to improve the speed of the generated code. This option can increase the size of generated code as the compiler performs aggressive inlining of functions. (This option is generally not recommended.)
- Fastest, Smallest [-Os] The compiler performs all optimizations that do not typically increase code size. This is the preferred option for shipping code because it gives your executable a smaller memory footprint.
- Fastest, Aggressive optimization [-Ofast] This setting enables ‘Fastest’ but also enables aggressive optimizations that may break strict standards compliance but should work well on well-behaved code.
Depending on the level LLVM makes several passes through given IR analysing and changing the code. Looking for the lists of specific passes for each optimization level I didn’t manage to find anything other that this SO answer which arises more additional questions. The official list of LLVM passes (without separation to different levels) can be found here.
When creating a new project Xcode sets up 2 configurations with following default values for the LLVM optimization levels:
- Debug: -O0 (none) - the fastest compile time, the easiest debugging
- Release: -Os (fastest, smallest) - the best combination of small binary size and fast runtime execution
Interestingly enough, configuration option responsible for C-family language optimisation calls (in project.pbxproj file) is called GCC_OPTIMIZATION_LEVEL. If you dive a bit in the history of Xcode you will see that till Xcode 3 the GCC (GNU Compiler Collection) was the compiler used by the IDE, then there was a transition period when the user could change the compiler in the target settings and with the release of Xcode 5 CLang became the only option (a piece of such history). Seems like the target property name still has that legacy.
Swift pipeline
Swift is young and rapidly developing language. So as it’s compiler. In terms of code optimisation some features are being changed and new features appear almost every year. (What I’m writing here about is valid for Swift 4.2 and Xcode 10)
Let’s take a look at the compilation pipeline for Swift:
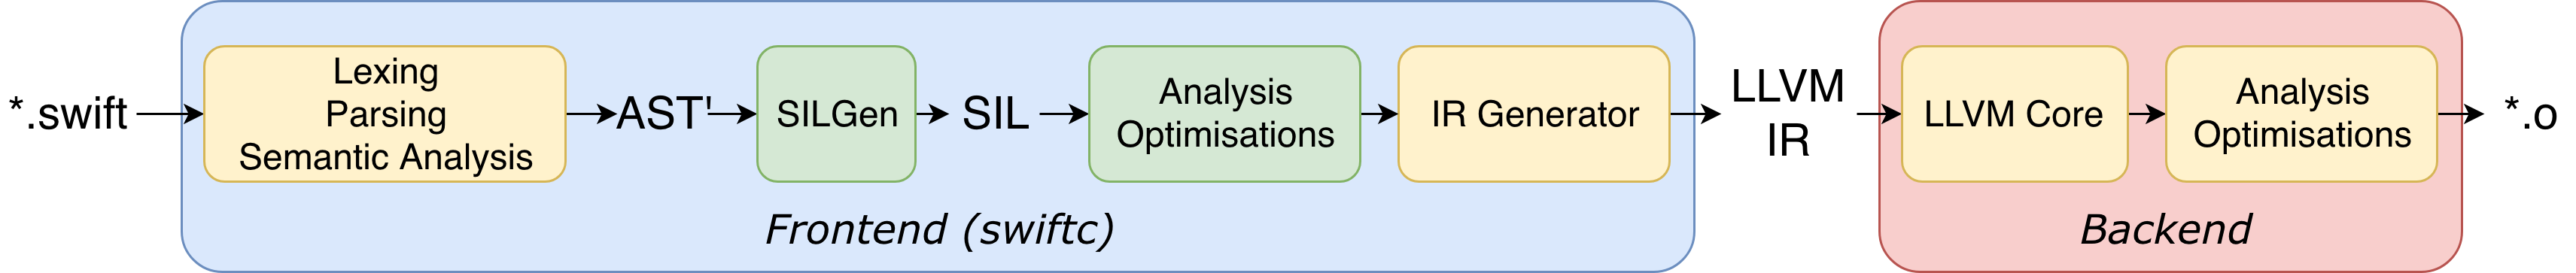
You can see lots of similarities with the one for ObjC: not only the same backend but also the frontend essentially works similarly. Lexical analysis, tokenization (separating some lexical items from the raw string), building AST, type checking. The main difference is the presence of SIL (Swift Intermediate Language) - another intermediate code representation between AST and LLVM IR.
The Swift development team took Clang as an example for a frontend, tried to use all Clang’s advantages and compensate some flaws. One of that flaws was inability to implement some high level analysis, reliable diagnostics and optimizations for which neither ATS nor LLVM IR were a proper material. So SIL was the solution for this problem.
Here is an example of how swift function looks in SIL:
func fibonacci(lim: Int) {
    var a = 0, b = 1
    while b < lim {
        print(b)
        (a, b) = (b, a + b)
    }
}
turns into
sil @fibonacci: $(Swift.Int) -> () {
  entry(%limi: $Swift.Int):
    %lim = struct_extract %limi: $Swift.Int, #Int.value
    %print = function_ref @print: $(Swift.Int) -> ()
    %a0 = integer_literal $Builtin.Int64, 0
    %b0 = integer_literal $Builtin.Int64, 1
    %lt = builtin "icmp_lt_Int64"(%b: $Builtin.Int64, %lim: $Builtin.Int64): $Builtin.Int1
    cond_br %lt: $Builtin.Int1, body, exit
    br loop(%a0: $Builtin.Int64, %b0: $Builtin.Int64)
  loop(%a: $Builtin.Int64, %b: $Builtin.Int64):
  body:
    %b1 = struct $Swift.Int (%b: $Builtin.Int64)
    apply %print(%b1) : $(Swift.Int) -> ()
    %c = builtin "add_Int64"(%a: $Builtin.Int64, %b: $Builtin.Int64): $Builtin.Int64
    br loop(%b: $Builtin.Int64, %c: $Builtin.Int64)
  exit:
    %unit = tuple ()
    return %unit: $()
}
So.. what’s about optimizations? You might already got it that for swift code we have the same low level LLVM optimizations made over LLVM IR, plus we have some set of additional optimizations made on a higher level by swift compiler over SIL.
At different steps the parts of the Swift compiler produce different kinds of SIL. At the beginning SILGen produces so called “raw SIL”. Raw SIL is just another representation of your code: no diagnostics, no changes, potential data flow errors. A small set of optimisations is being made on the raw SIL (even if you have all the optimizations switched off) - Guaranteed Optimization Passes and Diagnostic Passes:
- Mandatory inlining inlines calls to “transparent” functions.
- Memory promotion is implemented as two optimization phases, the first of which performs capture analysis to promote alloc_box instructions to alloc_stack, and the second of which promotes non-address-exposed alloc_stack instructions to SSA registers.
- Constant propagation folds constant expressions and propagates the constant values. If an arithmetic overflow occurs during the constant expression computation, a diagnostic is issued.
- Return analysis verifies that each function returns a value on every code path and doesn’t “fall off the end” of its definition, which is an error. It also issues an error when a noreturn function returns.
- Critical edge splitting splits all critical edges from terminators that don’t support arbitrary basic block arguments (all non cond_branch terminators).
If all diagnostic passes succeed, the final result is the “canonical SIL” for the program. Canonical SIL means that guaranteed optimizations and diagnostics were done, so all the data flow errors should be eliminated and certain instructions must be canonicalized to simpler forms. And here is the turn for General Optimization Passes, which are done (or not done) according to the optimization level you set up:
- Generic Specialization analyses specialized calls to generic functions and generates new specialized version of the functions. Then it rewrites all specialized usages of the generic to a direct call of the appropriate specialized function.
- Witness and VTable Devirtualization for a given type looks up the associated method from a class’s vtable or a type witness table and replaces the indirect virtual call with a call to the mapped function.
- Performance Inlining
- Reference Counting Optimizations
- Memory Promotion/Optimizations
- High-level domain specific optimizations. The Swift compiler implements high-level optimizations on basic Swift containers such as Array or String. Domain specific optimizations require a defined interface between the standard library and the optimizer.
Until Swift 4.1 swift compiler had only two optimization levels: [-Onone] and [-O]. But now there are already 3 different levels:
- None [-Onone]
- Optimize for speed [-O]
- Optimize for size [-Osize]
Optimization for speed includes all the General Optimization Passes listed before. Optimization for size (appeared in Swift 4.1) is claimed to have the same optimizations but with the additional parameter - size limitation. Basically the compiler tries to reduce code duplication when optimizing the code. Specifically it tries to be a bit smarter in function inlining (not doing the job if it doesn’t decrease a code size). Also the compiler is able to extract some code into a helper functions which also decrease the resulting code size. Optimization for size is an analog of Fastest, Smallest optimization made by LLVM.
The trade-off between the two optimization level is as following: size optimization can save you 5%-30% of the code size, performance optimization can improve the speed of the code up to 5%.
Of course we also shouldn’t forget about the Whole-Module Optimization (appeared in Swift 3). Now this property sits in the project settings as Swift compilation mode and has two options:
- Incremental (Single file in Xcode 9.3)
- Whole module
The essence of the optimisation is intelligibly described in the official swift blog. But briefly it’s not related to how the compiler process the source code, but what exactly it takes as an input for its work. In incremental (single file) mode the compiler works separately with each swift file doing all the analysis and optimisations. In a whole-module mode it “combines” all the swift source files in one module all together and takes the entire module as a source for all the processing. Of course every mode has its trade-offs. Whole-module optimisation has several significant benefits based on the bigger context for the optimizations (whole module instead of just one file) - when the compiler knows more about the code it can do much more for you in terms of optimisation. But it’s clear that in this case the compiler needs to recompile the entire module every time you run it, even if you made just a small change in one file (as there are know separate files for the compiler). That’s why by default in the new Xcode project the debug configuration has an incremental compilation mode (almost no optimizations, the fastest incremental compilation) and the release configuration has whole-module optimisation switched on (no need in benefits of incremental compilation, better optimisations).
There is also kind of an optimization option -Ounchecked compiler flag which was one of the options of the Optimization level in previous Xcode versions and now is called Disable Safety Checks. It’s responsible for removing some optimization passes related to things like int overflow. But there are some arguments if it’s an “optimization level” in a first place, and where is it’s place in the compiler.
We’ve already mentioned that there are 2 sets of optimisation passes for swift code: frontend optimizations (made by SIL optimizer) and backend optimization (made by LLVM Core). So you might think: “Wait.. if we have whole-module mode turned on and the compiler treats the entire module - which often means the entire project</em> - as the big chunk of code, so we miss all the concurrency benefits. We cannot process different parts of the module simultaneously anymore”. And partly you are right. For the frontend the compilation of the entire module is indeed one single process. But it seems that Apple engineers managed to split the module for LLVM, so at least the backend can apply some concurrency to speed up the compilation.
How can we use this information in our daily routine?
Ok. The last question is why should we care about the optimization level? Why just not trust apple with its predefined project settings and don’t waste the limited space in your head with this information?
Basically it’s that kind of knowledge which not just interesting to get, but also can suddenly be helpful in a future debugging in some cases which I cannot imagine now. But right here I can list at least couple of reasons why this can be useful.
Size/performance/time
There are several classical triangles like this when you have to prioritise the most important vertices because it’s all about trade-offs, if you pick one characteristic the other will inevitably suffer. Here we have size of the binary output, performance of the resulting code and time of compilation. So if we wan’t to achieve the smallest compilation time we should switch all the optimizations off and so the performance and the size will be worse than they could have been. If performance is our primary goal we should be ready to spare some extra time for the compiler and be ready that the resulting size might be a bit bigger because some performance optimizations cause code duplication. If the size is paramount so we will have not the best performance and not the minimal compilation time.
Fortunately engineers working on the compiler understand that usually we can sacrifice some performance in sake of the app size and some size in sake of performance, so we have optimization mode with the best combination of this two factors (needless to say that compilation time is the price we pay for that). As a result we have [-Os] optimization in LLVM and [-Osize] in Swift compiler, which aim to give us the best traid-off for production.
Debugging
I’ve already written that we don’t usually need optimizations switched on for the debug configuration. Firstly, we want to decrease the compilation time as we run the compiler dozens times a day. But other than that we don’t want the compiler to rearrange our code much because in this case it is hard to debug it. If the resulting code running on the device or simulator is highly optimized, it might be impossible for the debugger to fire your breakpoints, step into the code line-by-line or expose some variables for you. Debugging is kind of a reverse engineering that the debugger makes for you to connect some piece of running compiled code with the source code you see in IDE, and optimisations make this job way more difficult for the debugger.
Quite often there are several configurations in big production projects (more than just Debug and Release), and they might have different optimization levels. That’s definitely something you have to consider when switching from one configuration to another for debugging.
Assertions
Coming back to the original question about the asserts: first of all you need to understand that Swift and ObjC asserts are two different matters. So to handle them you have to separately communicate to both compilers.
Asserts in Swift
In case of Swift there are several types of asserts (you can read about them for instance here) by “assert” in the context of Swift I consider regular assert(_:_:file:line:) function
Removing asserts is one of the optimizations that swift compiler does (or does not depending on your settings). So as it said in the documentation if optimization level is -Onone you will have the asserts in your resulting code. If the level is different they will be optimized out of the code.
But Swift compiler also has a specific flag -assert-config which overwrites the optimization level for the assertions. So if you have this flag set with some value it will cancel whatever the optimization level defines for the assertions. The flag has string values: Debug, Release, Unchecked, DisableReplacement. Debug and DisableReplacemen values cause your swift asserts to remain in the resulting code; Release and Unchecked force the compiler to optimize them out. There is no dedicated property for it in the Xcode project settings so you have to add it in the Other Swift Flags section (-assert-config Unchecked for instance).
Asserts in Objective-C
In ObjC there are two types of assertions: assert(condition) coming from C and NSAssert(condition, comment) - so called Foundation Assertions.
The first hardcore one will be in the resulting code almost in all conditions regardless you configuration, optimisation level and the rest of the Xcode build settings. The only way to switch it off that I’m aware of is to define NDEBUG=1 Preprocessor Macros (together with DEBUG=1 which usually defined by default).
NSAssert is not so tough and handling it is easier: there is a bool property in the Xcode build settings Enable Foundation Assertions (ENABLE_NS_ASSERTIONS). Also assertions are disabled if preprocessor macro NS_BLOCK_ASSERTIONS is defined. But it also has nothing to do with the optimization level.
So eventually you don’t need to change any of the optimization levels in your project settings to switch the assertions on/off. Both compilers have special compilation flags for handling them.
Conclusion
There was my small journey started from the question about asserts and led me right into the compiler theory. On a high level I described the process of building the application from the source code, pointed out the place that code optimisation takes in this process. We also tried to figure out which types of optimizations are there and what exactly the compiler does to optimize your code. Eventually we got to know that optimization level has not so much to do optimizing out the asserts from the source code.
Additional references:
Clang:
LLVM:
LLVM optimization:
- Compiler-Level Optimizations section (developer.apple.com)
- Xcode Build Settings Reference (developer.apple.com)
Swift compiler:
Swift optimizations:
SIL: